Validation summary
The Sentinel-5p TROPOMI L2_HCHO data product (tropospheric HCHO column; De Smedt et al., 2018) is in good overall agreement with correlative ground-based measurements (NDACC FTIR and NDACC MAX-DOAS) and with the OMI QA4ECV HCHO satellite data. The bias estimate is positive over clean areas, and negative over polluted areas, but meets the mission requirement (see Table below). In clean conditions, the dispersion estimate meets the mission requirement.
| Product ID | Stream | Product | Bias | Dispersion | Special features |
| L2_HCHO | NRTI OFFL RPRO |
HCHO, low | +32% | 9 Pmolec/cm2 | Positive bias, low dispersion over clean areas (<2.5 Pmolec/cm2), Negative bias, high dispersion over polluted areas (>8 Pmolec/cm2) |
| HCHO, high | -30% | 25 Pmolec/cm2 |
A detailed description of the method and a comprehensive discussion of validation results can be found in the Quarterly Validation Report #21: April 2018 - November 2023.
| Latest Quarterly Validation Report | Product info | Current Processor Version |
| #21: April 2018 - November 2023 | See sentinel.esa.int |
02.06.01 |
References
De Smedt, I. et al. Algorithm theoretical baseline for formaldehyde retrievals from S5P TROPOMI and from the QA4ECV project Atmos. Meas. Tech., 11, 2395-2426 (2018) doi:10.5194/amt-11-2395-2018
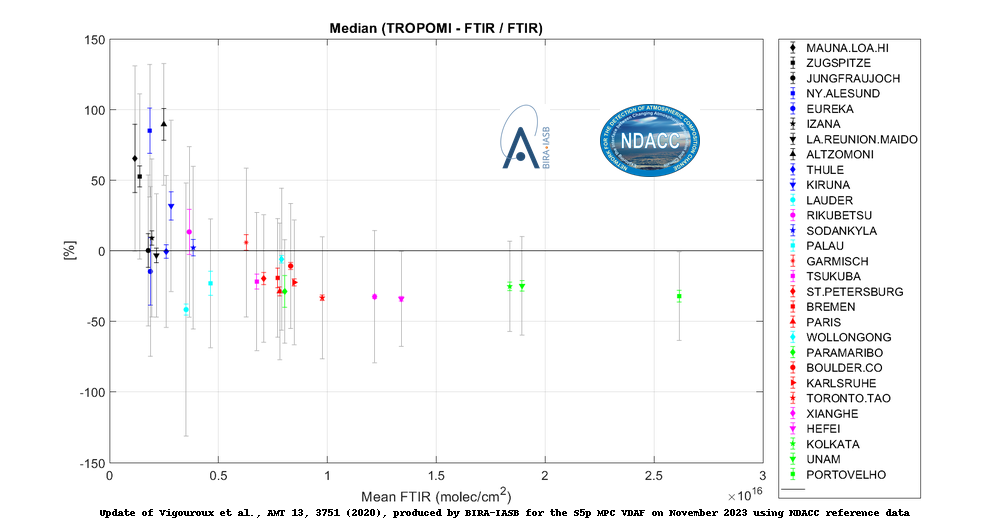
The graph below shows the bias between TROPOMI and NDACC FTIR data at each station (in %) displayed as a function of the mean FTIR total column value (molec/cm2). The gray bars are the systematic uncertainty on the differences, and the colored error bars are the 2-σ error on the bias. Following the procedure of Rodgers and Connor (2003), the FTIR a priori profile is replaced with that of TROPOMI, after which the TROPOMI averaging kernel is applied to this corrected FTIR profile. (© Update November, 2023 of Vigouroux et al., AMT 2020).

Sentinel-5p TROPOMI HCHO tropospheric column data is validated through comparisons to the following correlative ground-based measurements:
- Fourier Transform Infrared measurements (FTIR) of the NDACC network. The sensitivity of this instrument increases with altitude. The procedure of Rodgers and Connor (2003) is followed before the comparison is executed. Details on the methodology and results are described in Vigouroux et al., AMT 2020. The comparison method follows Vigouroux et al., ACP 2009.
- Multi-axis DOAS UV-visible measurements (MAX-DOAS). This measurement method has the highest sensitivity close to the surface, and is therefore complementary to the FTIR measurement. Details on the methodology and results are described in De Smedt et al., ACP 2021. The comparison method follows Vigouroux et al., ACP 2009.
- Direct Sun DOAS UV-Visible Pandora measurements from Pandonia Global Network, which measure the total column.
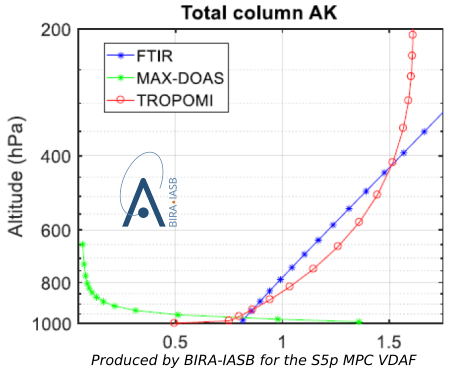
The figure below demonstrates the vertical sensitivity (by means of the total column averaging kernel) of TROPOMI (red), FTIR (blue) and MAX-DOAS (green). Both FTIR and TROPOMI have a low sensitivity near the surface and an increasing sensitivity at higher altitude, while MAX-DOAS has its highest sensitivity near the surface, which then decreases with altitude.

Sentinel-5p TROPOMI HCHO data are also compared to alternative retrievals, and to corresponding satellite data from the MetOp-B GOME-2 and Aura OMI instruments processed with the QA4ECV community method (De Smedt et al., 2018, EC FP7 QA4ECV project). Methodology and results on TROPOMI-OMI comparisons are described in De Smedt et al., ACP 2021.
References
De Smedt, I. et al. Comparative assessment of TROPOMI and OMI formaldehyde observations against MAX-DOAS network column measurements, Atmos. Chem. Phys., 10.5194/acp-21-12561-2021, 2021.
Vigouroux, C. et al., TROPOMI-Sentinel-5 Precursor formaldehyde validation using an extensive network of ground-based Fourier-transform infrared stations, Atmos. Meas. Tech., 7, 3751-3767, (2020), doi:10.5194/amt-13-3751-2020
Vigouroux, C. et al. Ground-based FTIR and MAX-DOAS observations of formaldehyde at Réunion Island and comparisons with satellite and model data, Atmos. Chem. Phys., 9, 9523-9544, (2009), doi:10.5194/acp-9-9523-2009
De Smedt, I. et al. Algorithm theoretical baseline for formaldehyde retrievals from S5P TROPOMI and from the QA4ECV project, Atmos. Meas. Tech., 11, 2395-2426 (2018) doi:10.5194/amt-11-2395-2018
Rodgers, C. D. and Connor, B. J. Intercomparison of remote sounding instruments, J. Geophys. Res., D3 ,108, 4116, (2003) doi:10.1029/2002JD002299
Correlative HCHO measurements used as a reference for satellite validation are collected from several ground-based monitoring networks contributing to WMO's Global Atmosphere Watch:
- Fourier Transform Infrared (FTIR) solar absorption spectrometers: About 27 FTIR instruments perform network operation, in the framework of the Network for the Detection of Atmospheric COmposition Change (NDACC), from clean Arctic and oceanic sites to very-high-concentration sites such as Porto Velho, in the Amazon basin.
- Multi-Axis Differential Optical Absorption Spectroscopy UV-Visible spectrometers (MAX-DOAS): Several of those instruments perform network operation in the framework of the Network for the Detection of Atmospheric COmposition Change (NDACC).
- Direct Sun DOAS UV-Visible Pandora instruments from Pandonia Global Network, currently contributing 30+ instruments.

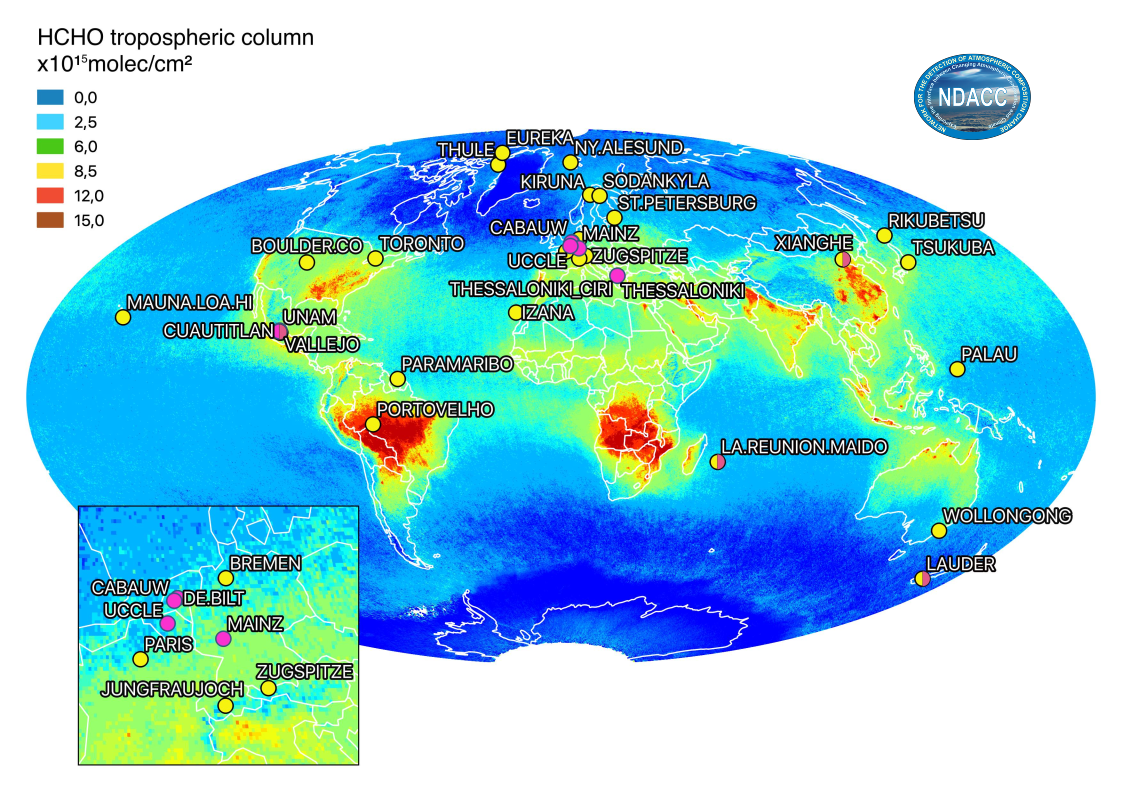
Geographical distribution of the spectrometers contributing HCHO correlative measurements to the validation of Sentinel-5p: TROPOMI: 27 NDACC FTIR (yellow) and MAX-DOAS (magenta). (© Update of Vigouroux et al., AMT 2020).
References
Vigouroux, C. et al. NDACC harmonized formaldehyde time series from 21 FTIR stations covering a wide range of column abundances, Atmos. Meas. Tech., 11, 5049-5073 (2018), doi:10.5194/amt-11-5049-2018
Correlative data is obtained via the following channels:
- S5PVT AO projects CESAR (ID #28596, PI A. Apituley, KNMI) and NIDFORVAL (ID #28607, PI G. Pinardi and C. Vigouroux, BIRA-IASB) for rapid data delivery from NDACC MAX-DOAS and FTIR stations,
- the NDACC Data Host Facility, mirrored at EVDC and at BIRA-IASB for satellite validation purposes.
The Sentinel-5p Mission Performance Centre provides an operational validation service relying on the VDAF Automated Validation Server (VDAF-AVS). This fully automated data analysis system collects correlative measurements from quality-controlled monitoring networks and compares them to Sentinel-5p data using community endorsed protocols. It outputs a suite of traceable quality indicators enabling users to judge the fitness-for-purpose of the Sentinel-5p data.
The illustrations given hereafter show the automated comparison of Sentinel-5p tropospheric HCHO column data with respect to correlative measurements acquired by (i) a MAX-DOAS UV/Visible spectrometer of the Network for the Detection of Atmospheric COmposition Change and (ii) a direct Sun DOAS Pandora spectrometer of the Pandonia Global Network. More HCHO validation results are available at http://mpc-vdaf-server.tropomi.eu/hcho
The VDAF Automated Validation Server in brief:
- hosted at BIRA-IASB and operated with s[&]t,
- provides routine validation for the ESA/Copernicus Sentinel-5p Mission Performance Centre,
- ingests correlative measurements from the ESA Atmospheric Validation Data Centre (EVDC) hosted at NILU, collected from ESA's Fiducial Reference Measurements (FRM) programme and from ground-based monitoring networks contributing to WMO's Global Atmosphere Watch,
- builds on heritage from the Multi-TASTE satellite validation system, the QA4ECV validation server (EC FP7 QA4ECV project) and the CAMS NDACC validation server (EC FP7 NORS project),
- is co-funded by ESA and the Belgian Science Policy Office (BELSPO) as a contribution to the Copernicus Space Component.
Latest validation information
Please consult the Quarterly Validation Report #21: April 2018 - November 2023
Access to older reports
For access to older reports: click here