Page 2 of 6
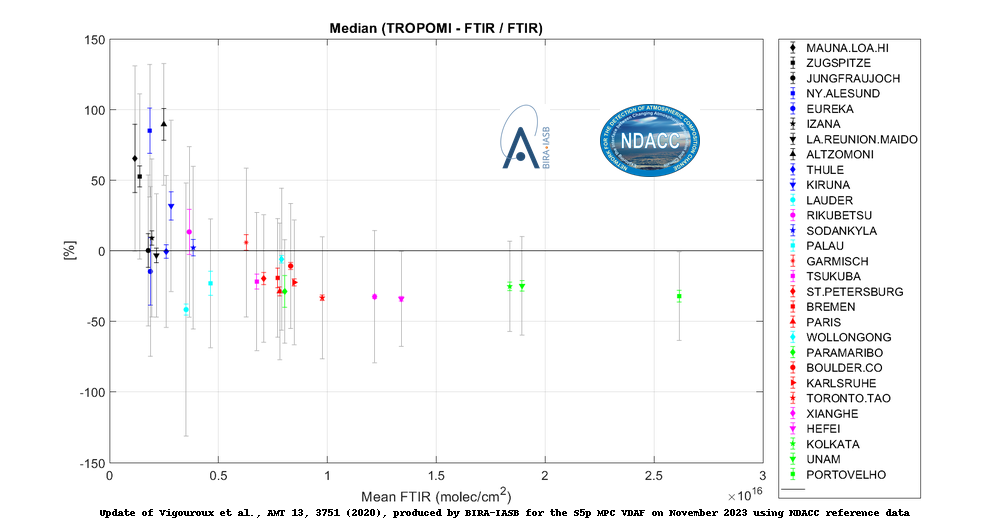
The graph below shows the bias between TROPOMI and NDACC FTIR data at each station (in %) displayed as a function of the mean FTIR total column value (molec/cm2). The gray bars are the systematic uncertainty on the differences, and the colored error bars are the 2-σ error on the bias. Following the procedure of Rodgers and Connor (2003), the FTIR a priori profile is replaced with that of TROPOMI, after which the TROPOMI averaging kernel is applied to this corrected FTIR profile. (© Update November, 2023 of Vigouroux et al., AMT 2020).