Validation Summary
Sentinel-5p TROPOMI provides one operational ozone profile data product: L2_O3_PR Ozone Profile
Accurate retrieval of nadir ozone profile data requires the recalibrated TROPOMI Level-1b data (v2). Operational TROPOMI ozone profile data (v2.3) based on L1b v2.0 have become publicly available since November 29, 2021. A switch to L2 processor version 2.4 has been made in July 2022, followed by a reprocessing of the entire dataset based on L1b v2.1 with improved soft-calibration. Routine validation results for the NRTI and RPRO/OFFL ozone profile streams are provided here.
Comparison of the Sentinel-5p TROPOMI L2_O3_PR data (May 2018 to November 2023 for both NRTI and RPRO/OFFL channels of the operational NL-L2 processors) with ozonesonde and lidar measurements concludes to a median agreement better than 5 to 10 % in the troposphere and up to the upper troposphere/lower stratosphere (UTLS). The bias goes up to -15 % in the higher stratosphere (35-45 km), but with vertical oscillations. The comparisons show a dispersion of order of 30 % in the troposphere, and 10 to 20 % in the UTLS and upper stratosphere. Chi-square tests demonstrate that on average the observed differences confirm the ex-ante satellite and ground uncertainty estimates in the stratosphere, above about 20 km. Around the tropopause and below (around 15-20 km and lower), the mean chi-square value increases up to about four. Here, the retrieved satellite uncertainty is smaller than what is actually observed.
The information content of the ozone profile retrieval is characterised by about five to six vertical sub-columns of independent information (estimated from the Degrees of Freedom) and a vertical sensitivity nearly equal to unity at altitudes from about 20 km (UTLS) to 50 km, and decreasing rapidly at altitudes above and below. The altitude registration of the retrieved profile information usually is close to the nominal retrieval altitude in the 20-50 km altitude range, and shows positive and negative offsets of up to 10 km below and above the 20-50 km altitude range, respectively. The effective vertical resolution of the profile retrieval usually ranges within 10-15 km, with a minimum close to 7 km in the middle stratosphere. Increased sensitivities and higher effective vertical resolutions can be observed for higher solar zenith angles, as can be expected, and correlates with higher retrieved ozone concentrations. On the other hand, one can also observe some lower-DFS profiles with nearly-zero surface sensitivity in combination with a highly overcompensating sensitivity around the UTLS, ranging up to three and above. These retrievals occur for scenes that have both high SZA and high surface albedo, mostly around the Antarctic (latitudes from 60 to 90 south).
A solar-zenith angle dependence is observed for the lowest ozone subcolumns, which translates into a seasonal and meridian dependence of their bias. Whereas there is an increase of the DFS and bias for the 6-12 km column with SZA, this correlation seems to be somewhat compensated for the lowest column by increased atmospheric penetration of the sunlight at low solar-zenith angles (0 to about 30°). A similar but reduced effect can be seen for the viewing-zenith angle. Additionally, the bias is clearly negatively correlated with the surface albedo for the 6-12 km subcolumn, despite the latter’s apparently slightly positive correlation with the retrieval DFS.
The more than five years of TROPOMI ozone profile data show a slight DFS degradation throughout the mission (next to a jump from the ground pixel resolution change). Comparisons with ozonesonde data reveal significant positive drifts near 2 %/year in the tropics and mid-latitudes from the surface to the UTLS, while 1-2 % per year negative drifts are observed above. This makes the current operational TROPOMI ozone profile product and its subcolumn derivatives unsuitable for vertically resolved trend studies. However, no significant drift is detected for the vertically integrated profile. This agrees with the operational TROPOMI total ozone column retrieval.
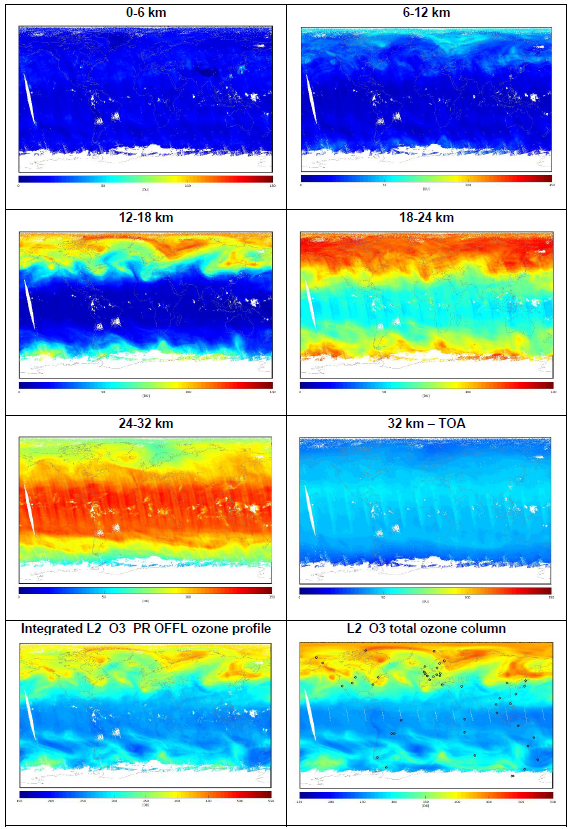
Global maps of the six ozone profile sub-columns show the geographical coverage of the data, but also a slight along-orbit striping, especially in the middle stratosphere (24-32 km sub-column). Global maps of the integrated L2_O3_PR ozone profile data and of the L2_O3 total column data look mutually consistent, although the latter is about 5 % higher than the integrated ozone profile on average. On the other hand, orbit curtain plots reveal that for some ground pixels the retrieved ozone profile deviates strongly and non-physically from the a-priori profile used in the retrieval. This issue needs further examination. Finally, in the absence of clouds, data files sometimes contain negative surface albedo values. The ground pixels affected by this anomaly are usually located at the east and west edges of the TROPOMI measurement swath.
| Product ID | Stream | Version | Orbits | Bias (req. 30 %) | Disp. (req. 10 %) | Special features |
|---|---|---|---|---|---|---|
| L2_O3_PR | NRTI | 02.04.00 02.05.00 |
24697-28074 28078-now |
5-10 % | 10-30 % | Mean agreement better than 5 to 10 % in the troposphere and UTLS. Bias goes up to -15 % in the higher stratosphere (35-45 km), but with vertical oscillations. Dispersion of order of 30 % in the troposphere, and 10 to 20 % in the UTLS and upper stratosphere. |
| OFFL | 02.04.00 02.05.00 |
24655-28030 28031-now |
5-10 % | 10-30 % | ||
| RPRO | 02.04.00 | 2818-24779 | 5-10 % | 10-30 % |
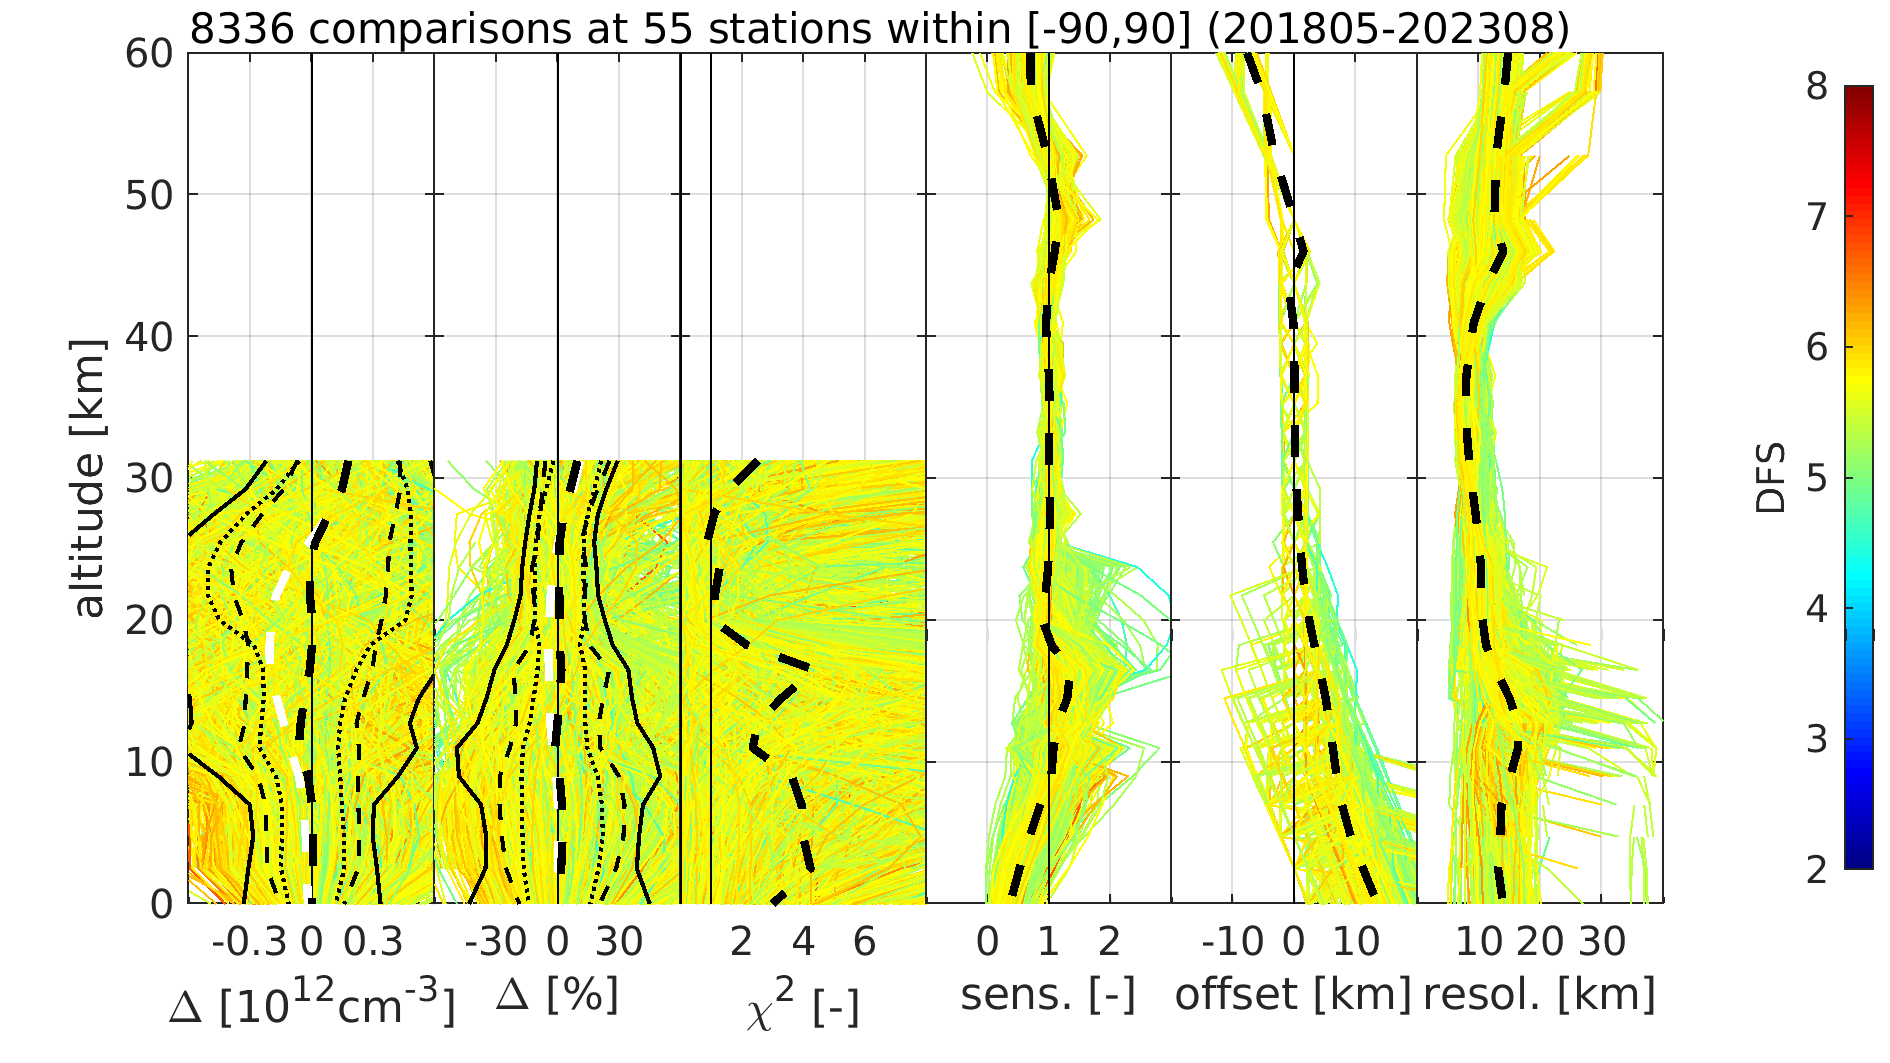
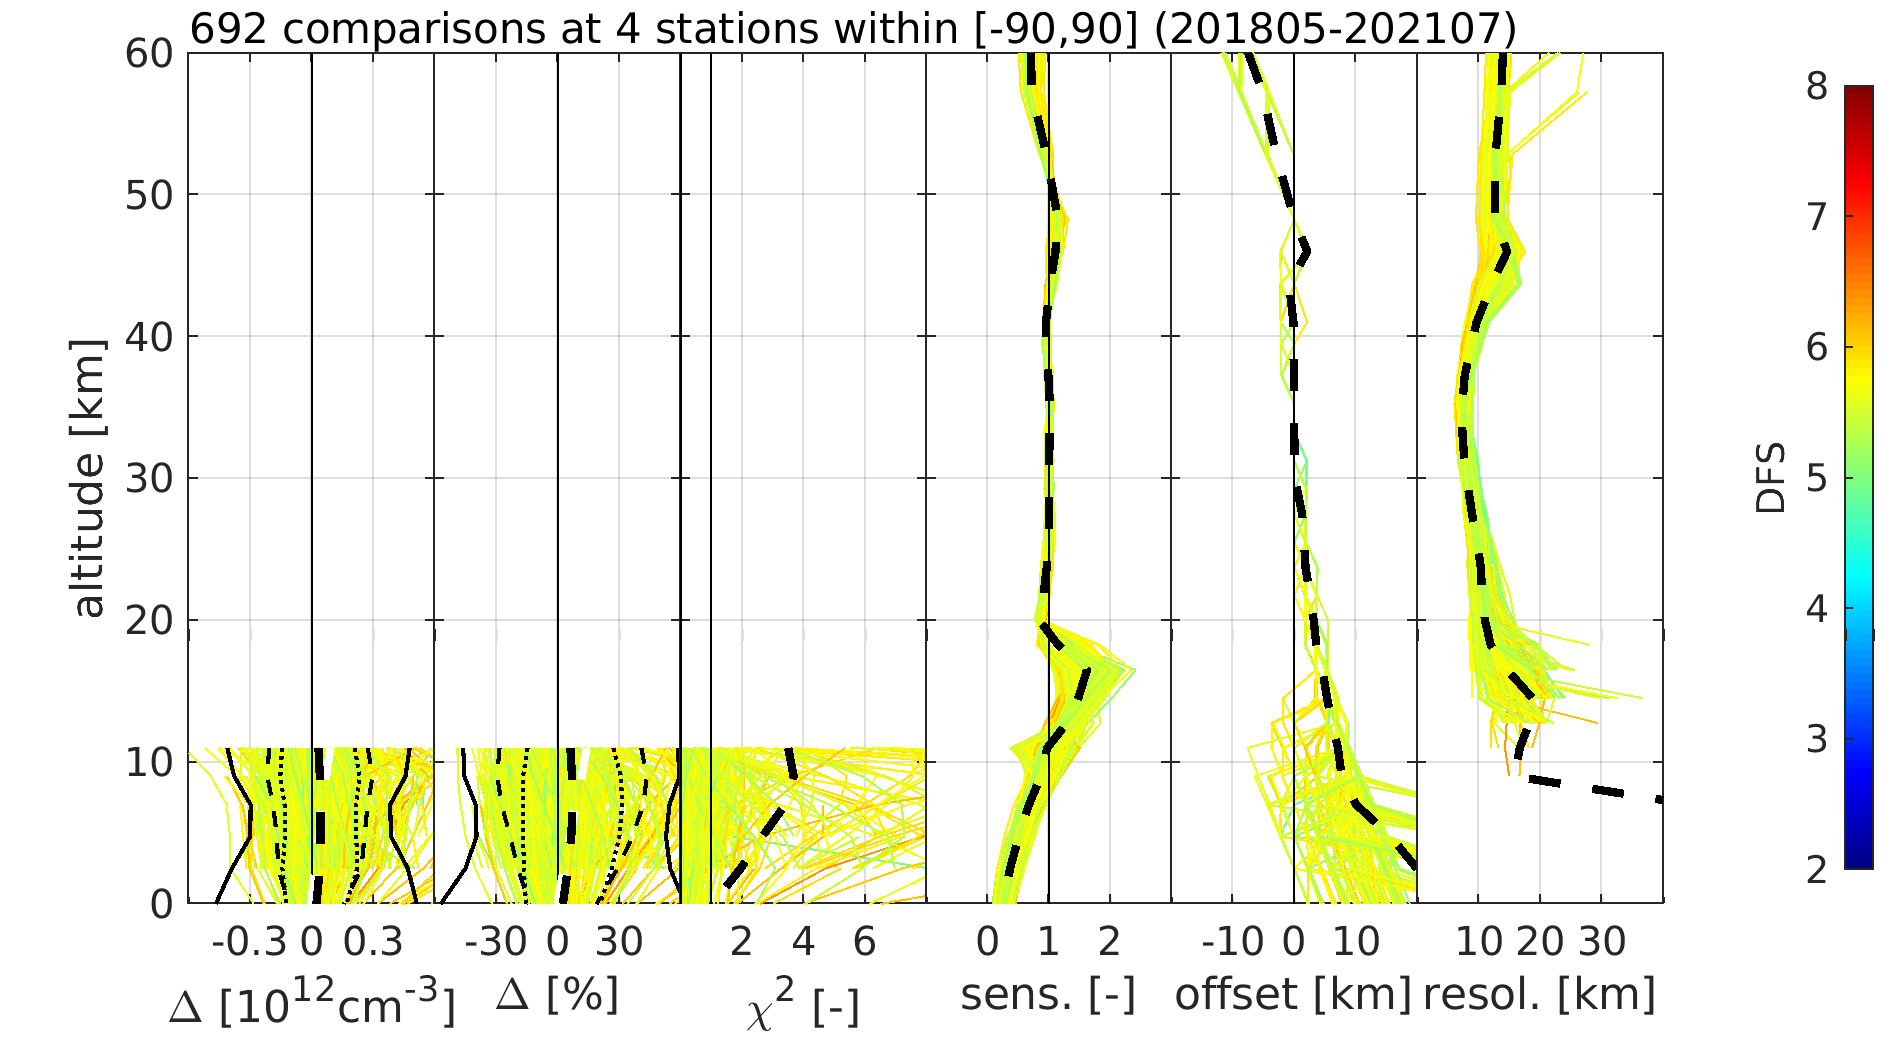
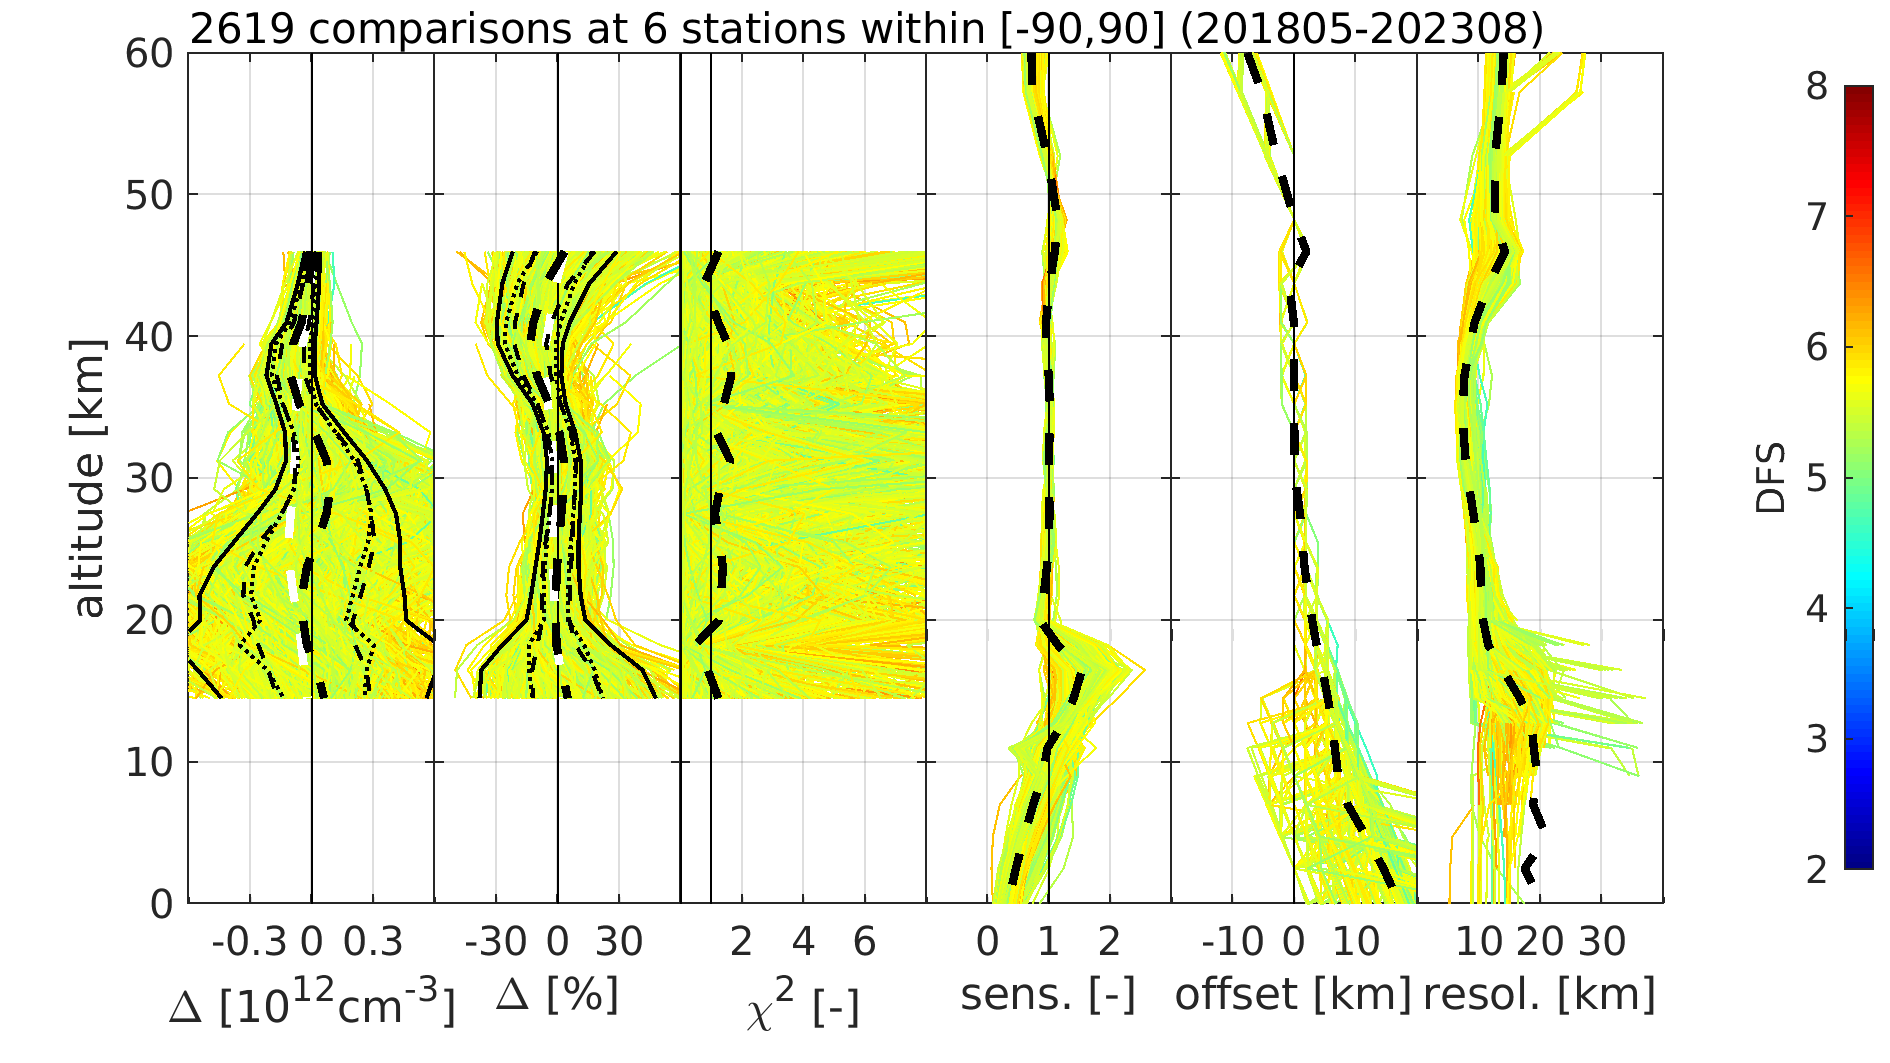
The graphs below show the comparison between S5P L2_O3_PR OFFL ozone number density profile data and all co-located ground-based reference measurements (May 2018 to November 2023, top: ozonesondes, middle: tropospheric lidar, bottom: stratospheric lidar). From left to right: the difference and the percent relative difference between S5P and ozonesonde data, the chi-square profile, the vertical sensitivity, the altitude registration offset, and the averaging kernel FWHM associated with the S5P retrieval. The colour scale indicates retrieval degrees of freedom. Black dashed lines show mean values (thick lines) and standard deviations (thin lines, around the mean), while white dashed lines indicate the mean difference between the a-priori profile and the reference measurement. Dotted black lines indicate the total ex-ante (inductive) uncertainty of TROPOMI and the reference measurements combined (around the mean difference).
A detailed description of the method and a comprehensive discussion of validation results can be found in the Quarterly Validation Report #21: April 2018 - November 2023.
Validation Method
Validation of the S5P TROPOMI L2_O3_PR ozone profile data entails quantitative comparisons to independent reference measurements collected from ground-based monitoring networks, cross-validation with other satellite instruments, assessment of the retrieved information content based on the analysis of the associated averaging kernels, and visual inspections of daily maps of S5P ozone data and associated parameters.
Ground-based networks:
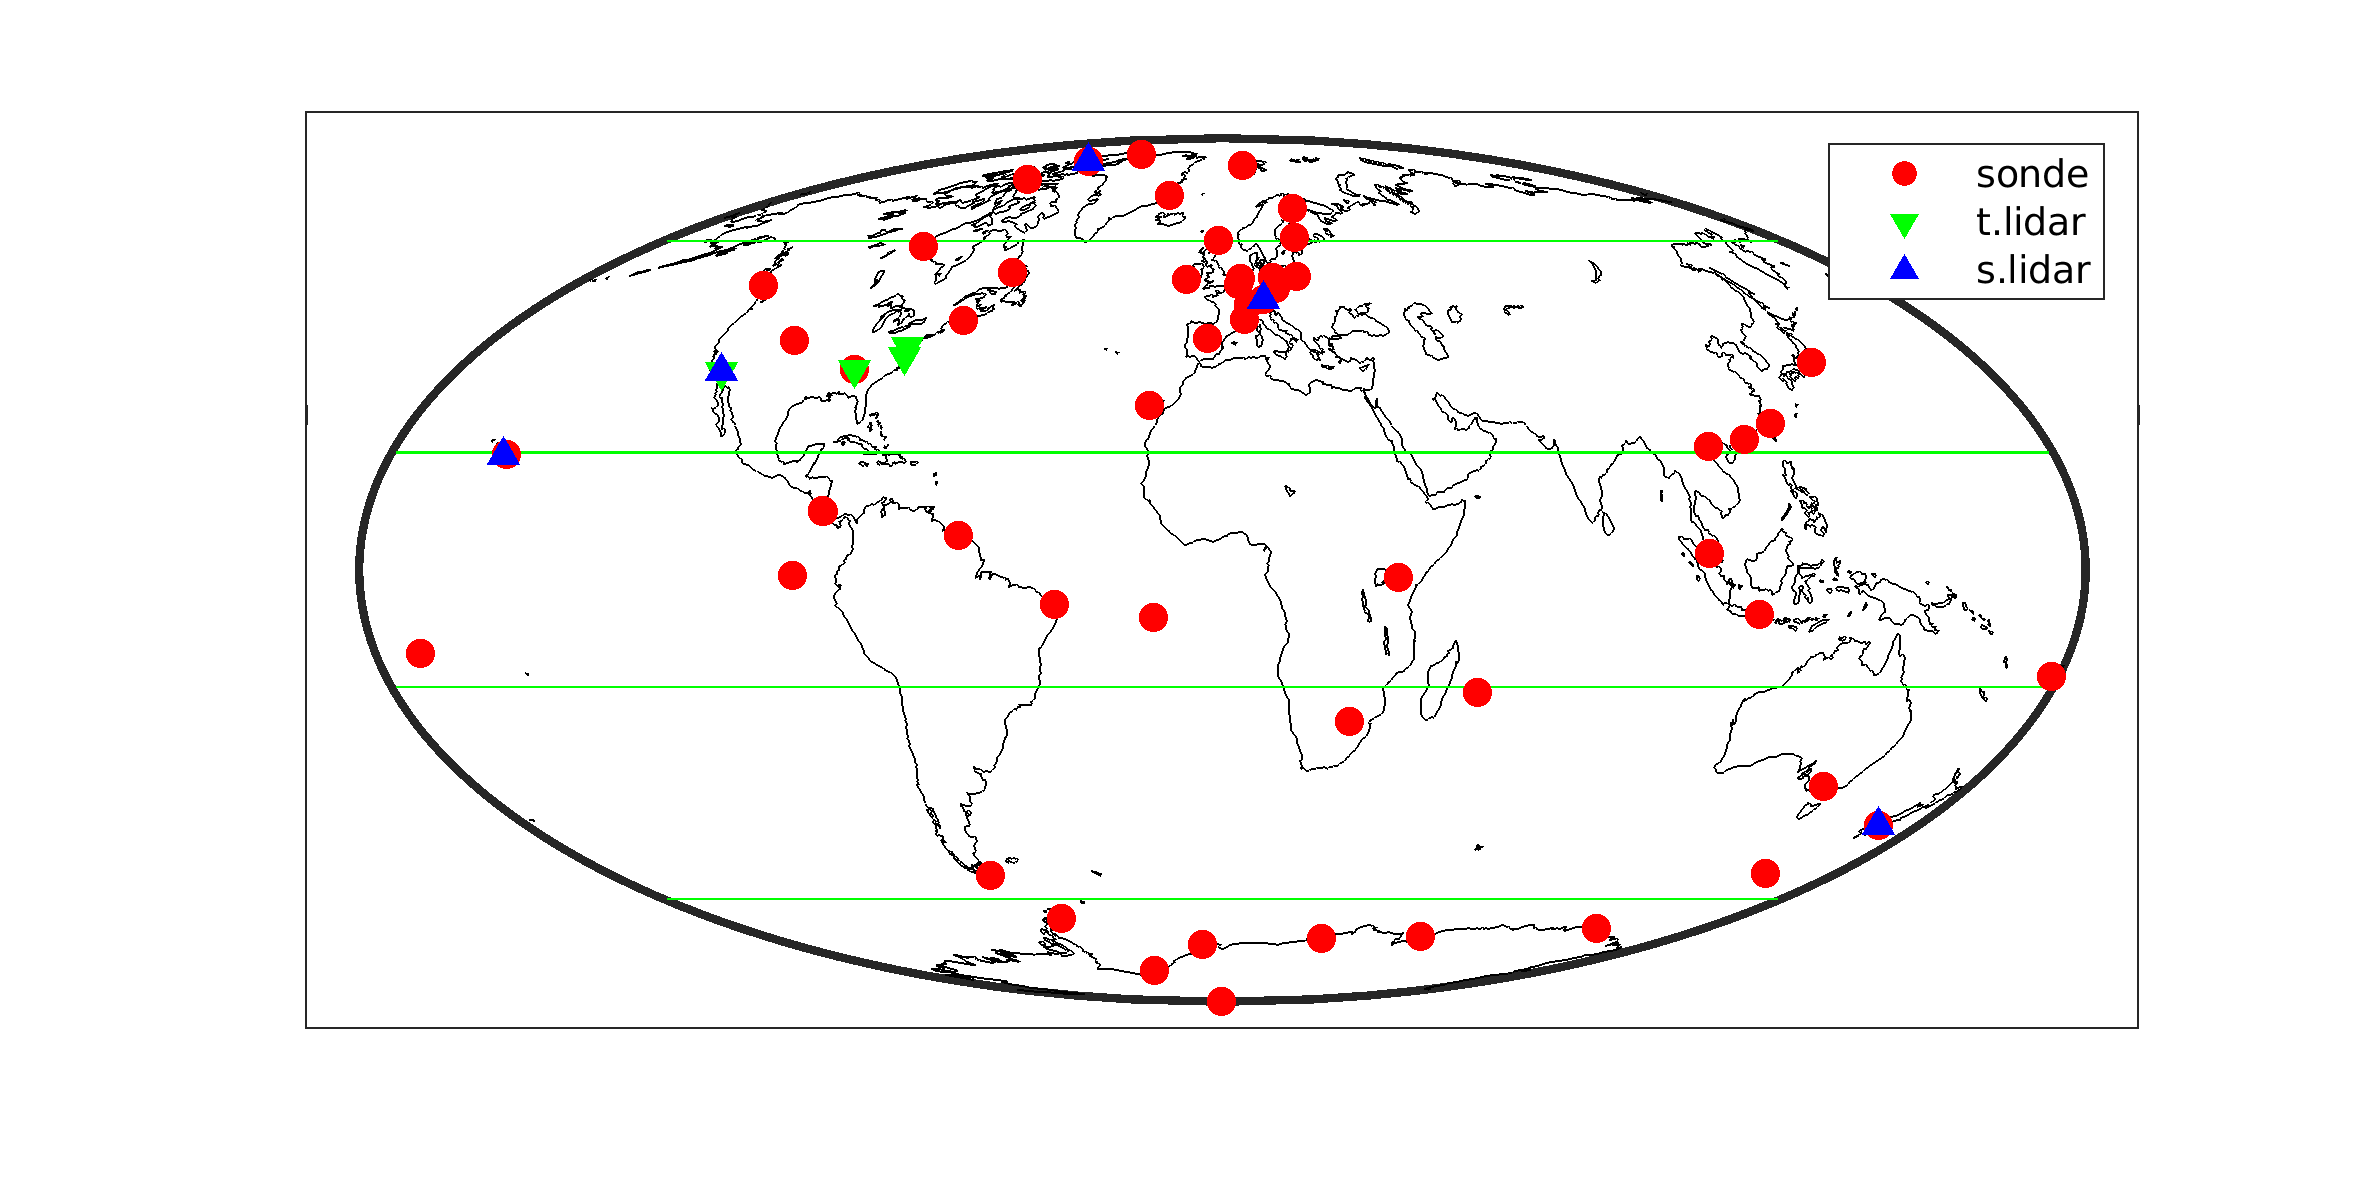
Comparison results between ground-based reference measurements and coincident TROPOMI L2_O3_PR pixels (overpass pixel on the same day with qa_value > 0.5) are obtained through the versatile Multi-TASTE validation system at BIRA-IASB, as part of both S5P MPC and S5PVT CHEOPS-5p validation activities. Prior to their comparison to S5P data, ground-based measurements – acquired at higher vertical resolution than S5P profile data – are convolved with the averaging kernels associated with the S5P retrievals to account for vertical smoothing differences (see Rodgers and Connor, 2003, Calisesi et al. 2005, Keppens et al., 2019). The difference of L2_O3_PR ozone number density values with respect to ozonesonde measurements is reported as a function of a selection of influence quantities, together with the information content diagnostics: vertical sensitivity, altitude registration offset, and averaging kernel full width at half maximum (FWHM). The geographical distribution of the ozonesonde stations indicates the domain of applicability of the validation results.
For the routine validation of the S5P/TROPOMI ozone profiles, the automated validation server (AVS) deployed within the MPC VDAF facility is used. This facility collects S5P ozone profile data and correlative measurements to identify suitable co-locations, compare the co-located data, and produce S5P data quality indicators. The VDAF-AVS produces curtain plots (ozone number density as a function of altitude and time) of the satellite data at a selection of ground-based ozonesonde stations, together with curtain plots showing the difference between S5P and ground-based data. The VDAF-AVS also provides statistical estimates of the bias and dispersion of S5P data with respect to the ground-based measurements.
Satellite intercomparisons:
Comparison to other satellite data extend ground-based validation to the global domain and increase the number of data comparisons. For stratospheric ozone, comparisons to limb and solar occultation sounders (MLS, OMPS-limb, ACE-FTS) are appropriate. For tropospheric ozone, comparisons can be made to OMI and OMPS-nadir, where the OMPS-nadir measurements have the best spatial and temporal co-registration with TROPOMI.
Analysis of information content:
The information content of the S5P ozone profile data is assessed through algebraic analysis of the associated averaging kernel matrix (AK) generated by the same S5P processing algorithm. The row sums of the AK matrix indicate the vertical sensitivity of the S5P ozone profile retrieval (Rodgers, 2000). The trace of the AK kernel matrix gives the Degree of Freedom of the Signal (DFS), to be understood here as the amount of vertical sub-columns with independent ozone information from each other. The Full Width at Half Maximum (FWHM) of the AK corresponding to a given altitude gives an indication of the vertical resolution of the retrieved profile at this altitude. This effective resolution of the retrieved information is not the numerical resolution of the vertical grid used for the retrieval process, usually much higher than the true, physical resolution of the retrieved information. The true altitude registration of the retrieved profile information at a given altitude of calculation can be estimated as the barycentre of the associated AK at this calculation altitude.
Daily global maps:
The S5P MPC VDAF creates daily global maps of the six partial columns provided in the ozone profile product, together with the integrated total column. The latter is compared with the daily global map of the TROPOMI total column retrieval to assess their mutual consistency. Daily global maps easily allow identifying data gaps, retrieval artefacts, along-orbit striping, and other large-scale features that are not typically detected through comparison with respect to point-like ground-based data.
Parameter correlation checks:
Using the in-house PyCAMA software, correlation checks are performed by KNMI on a broad selection of satellite data parameters within the orbit files. These checks provide a view on single-orbit features, correlations between retrievals of subsequent pixels, the appropriateness of the data flagging, etc. Relevant results can be found on the TROPOMI Portal for Level-2 Quality Control.
References
- Calisesi, Y., Soebijanta, V. T., and van Oss, R. Regridding of remote soundings: Formulation and application to ozone profile comparison. J. Geophys. Res. 110, https://doi.org/10.1029/2005JD006122, 2005.
- Keppens, A., Compernolle, S., Verhoelst, T., Hubert, D., and Lambert, J.-C. Harmonization and comparison of vertically resolved atmospheric state observations: Methods, effects, and uncertainty budget, Atmos. Meas. Tech. 12, https://doi.org/10.5194/amt-12-4379-2019, 2019.
- Rodgers, C. D. Inverse Methods for Atmospheric Sounding. World Scientific, 2000.
-
Rodgers, C. D. and Connor, B. J. Intercomparison of remote sounding instruments. J. Geophys. Res. 108, https://doi.org/10.1029/2002JD002299, 2003.
Validation Data
S5P TROPOMI L2_O3_PR ozone profile data are routinely compared to ground-based measurements acquired by instruments contributing to WMO’s Global Atmosphere Watch (GAW), the Network for the Detection of Atmospheric Composition Change (NDACC), Southern Additional Ozonesonde programme (SHADOZ), and Tropospheric Ozone Lidar Network (TOLNET): (1) balloon-borne ozonesondes, (2) tropospheric differential absorption ozone lidars (DIAL), and (3) stratospheric DIAL. The ground-based data are collected through ESA’s Validation Data Centre (EVDC) and the respective data host facilities of the ground-based networks. A map containing all station locations is shown below.
VDAF Validation Server
The Routine Operations Validation Service provided by the Sentinel-5p Mission Performance Centre relies on the VDAF Automated Validation Server (VDAF-AVS). This fully automated data analysis system collects correlative measurements from quality-controlled monitoring networks and compares them to Sentinel-5p data using community endorsed protocols. VDAF-AVS outputs a suite of traceable quality indicators enabling users to judge the fitness-for-purpose of the Sentinel-5p data.
The VDAF Automated Validation Server in brief:
- hosted at BIRA-IASB and operated with s[&]t,
- provides routine validation for the ESA/Copernicus Sentinel-5p Mission Performance Centre,
- ingests correlative measurements from the ESA Atmospheric Validation Data Centre (EVDC) hosted at NILU, collected from ESA's Fiducial Reference Measurements (FRM) programme and from ground-based monitoring networks contributing to WMO's Global Atmosphere Watch,
- builds on heritage from the Multi-TASTE satellite validation system, the QA4ECV validation server (EC FP7 QA4ECV project) and the CAMS NDACC validation server (EC FP7 NORS project),
- is co-funded by ESA and the Belgian Science Policy Office (BELSPO) as a contribution to the Copernicus Space Component.
Daily global maps
The S5P MPC VDAF creates daily global maps of the six partial columns provided in the ozone profile product, together with the integrated total column. The latter is compared with the daily global map of the TROPOMI total column retrieval to assess their mutual consistency. Daily global maps easily allow identifying data gaps, retrieval artefacts, along-orbit striping, and other large-scale features that are not typically detected through comparison with respect to point-like ground-based data. The figure below contains daily global maps for the six partial columns in the S5P L2_O3_PR OFFL v02.03.01 ozone profile product of November 23, 2021, with colour scales going from 0 to 150 DU. The two lower plots show total ozone column values obtained by integration of the TROPOMI L2_O3_PR profile data (left) and the map of TROPOMI L2_O3 total ozone column values for the same day (right) to check for their mutual consistency, with colour scales going from 0 to 550 DU.
Latest Issue
Quarterly Validation Report of the Copernicus Sentinel-5 Precursor Operational Data Products #21: April 2018 - November 2023
Archive
Previous issues of the quarterly validation report are archived here.