Page 5 of 6
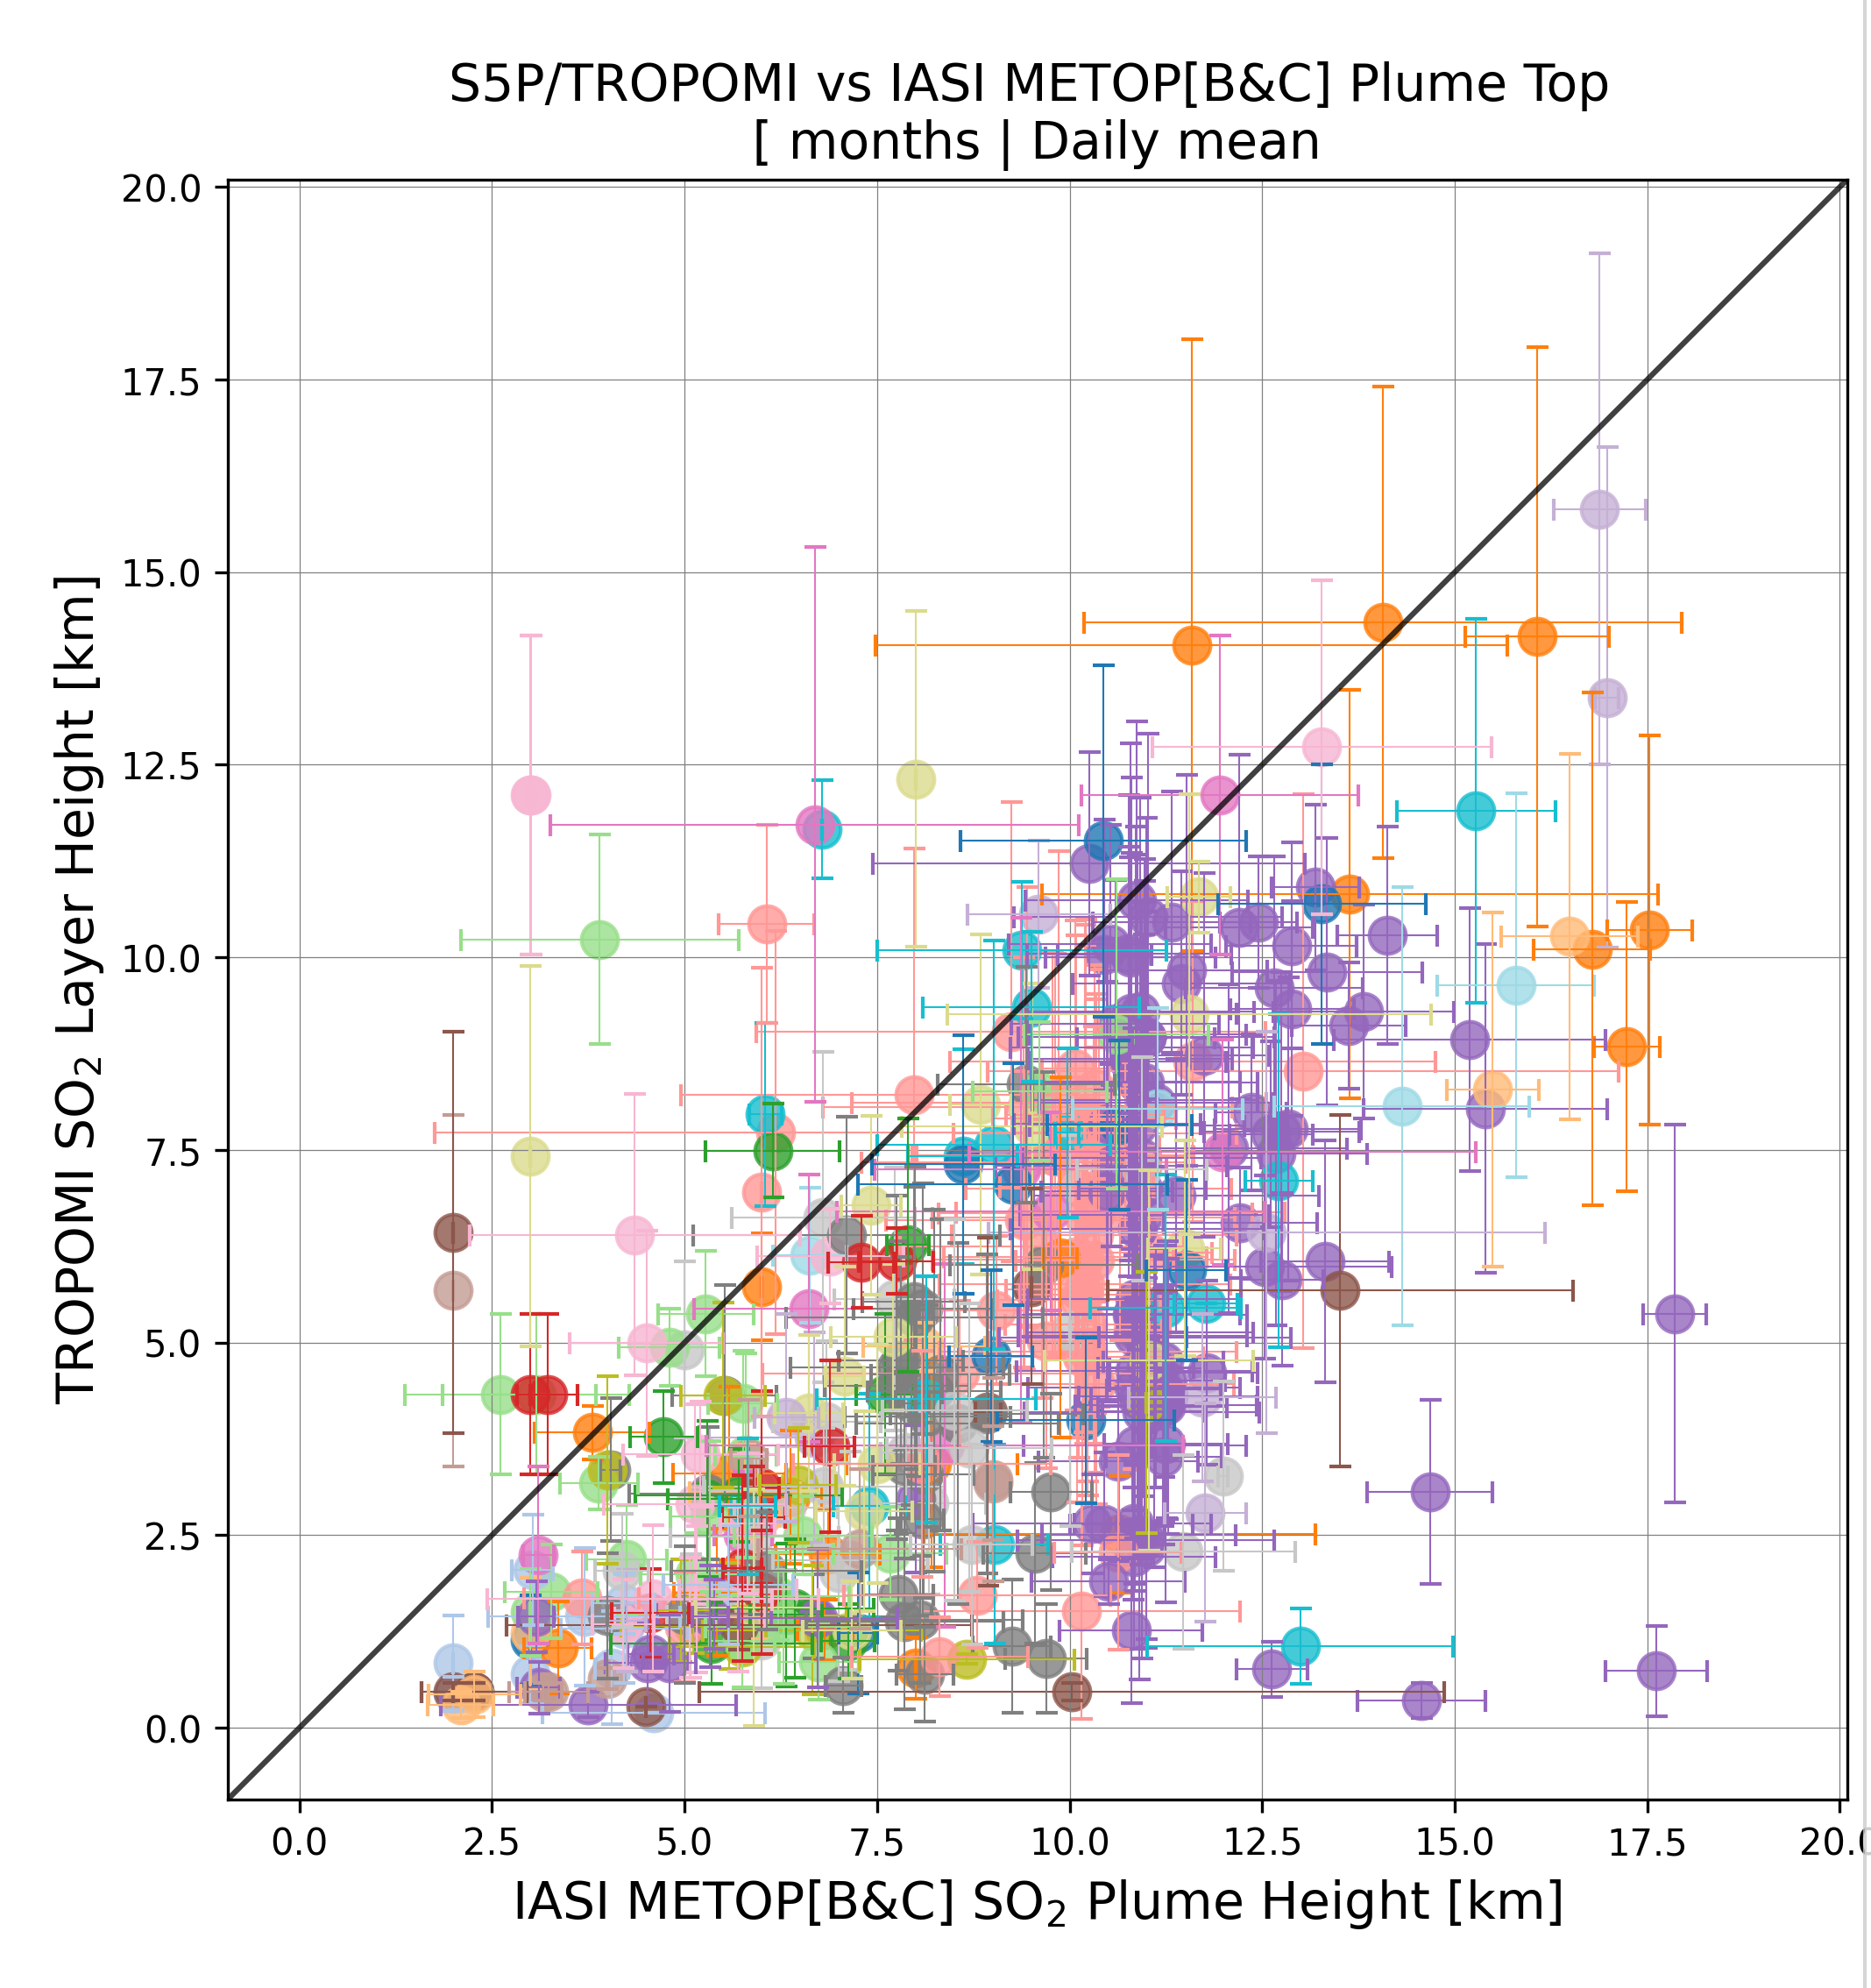
The figure shows the comparison between the daily mean TROPOMI SO2 layer height observations (y-axis) and combined IASI/Metop-[B&C] observations retrieved during volcanic eruptions of the May 2018 – August 2026 period.
The figure shows the comparison between the daily mean TROPOMI SO2 layer height observations (y-axis) and combined IASI/Metop-[B&C] observations retrieved during volcanic eruptions of the May 2018 – August 2026 period.